
NIC Capture
Proxy capture shows you “the part of the traffic that goes through the proxy”; NIC capture shows you everything flowing across this machine’s NIC: DNS, QUIC, games, IoT, all kinds of proprietary protocols. Anything that crosses the NIC is right in front of you. And it goes a big step further than traditional capture tools: the HTTPS you capture is no longer a pile of ciphertext, but something you can decrypt, attribute to whoever sent it, and take apart to understand.
1. How it differs from proxy capture
Section titled “1. How it differs from proxy capture”The two are complementary ways to capture, each with its own use cases:
| Proxy capture | NIC capture | |
|---|---|---|
| How you tap in | Route traffic through a proxy + trust a certificate | Capture the raw packets on the NIC directly, without changing any settings or installing a certificate |
| What you can see | Traffic that went through the proxy, mainly HTTP(S) | All traffic on the NIC: DNS, QUIC, ICMP, ARP, any TCP / UDP… |
| Plaintext by default? | Plaintext by default | Ciphertext by default; “Decrypt this program” in one click when needed (see below) |
| Best for | Debugging HTTP APIs, rewriting / replaying | Viewing non-HTTP traffic, seeing everything a program does on the network, avoiding any system-level changes |
In short: proxy capture is “precise,” NIC capture is “complete.” If you want to know exactly which addresses an app is quietly connecting to and which protocols it uses, NIC capture lays it all bare.
2. How it differs from traditional NIC capture tools
Section titled “2. How it differs from traditional NIC capture tools”Traditional NIC capture tools can grab the packets, but the HTTPS they capture is a pile of ciphertext, and they also have no idea which program sent it. NIC capture builds on “can capture” and fills in “can understand, can trace”:
- Can decrypt: turn a program’s HTTPS from ciphertext back into plaintext in one click (see Section 4), instead of only being able to look at ciphertext.
- Knows who sent it: every flow is tagged with its source process, so you can pinpoint it at a glance even in a noisy environment.
- Can trace the peer’s background: click a remote IP to go straight to its host profile (attribution / geography / certificate).
- Can take it apart and understand it: captured data is automatically decompressed, format-detected, and displayed in a structured way, and proprietary protocols can be decoded with a custom decoder (see Section 6).
- Can also feed Wireshark: when you need professional packet-by-packet analysis, forward the traffic live to Wireshark in one click, where it opens as plaintext, even on another machine.
3. How to capture
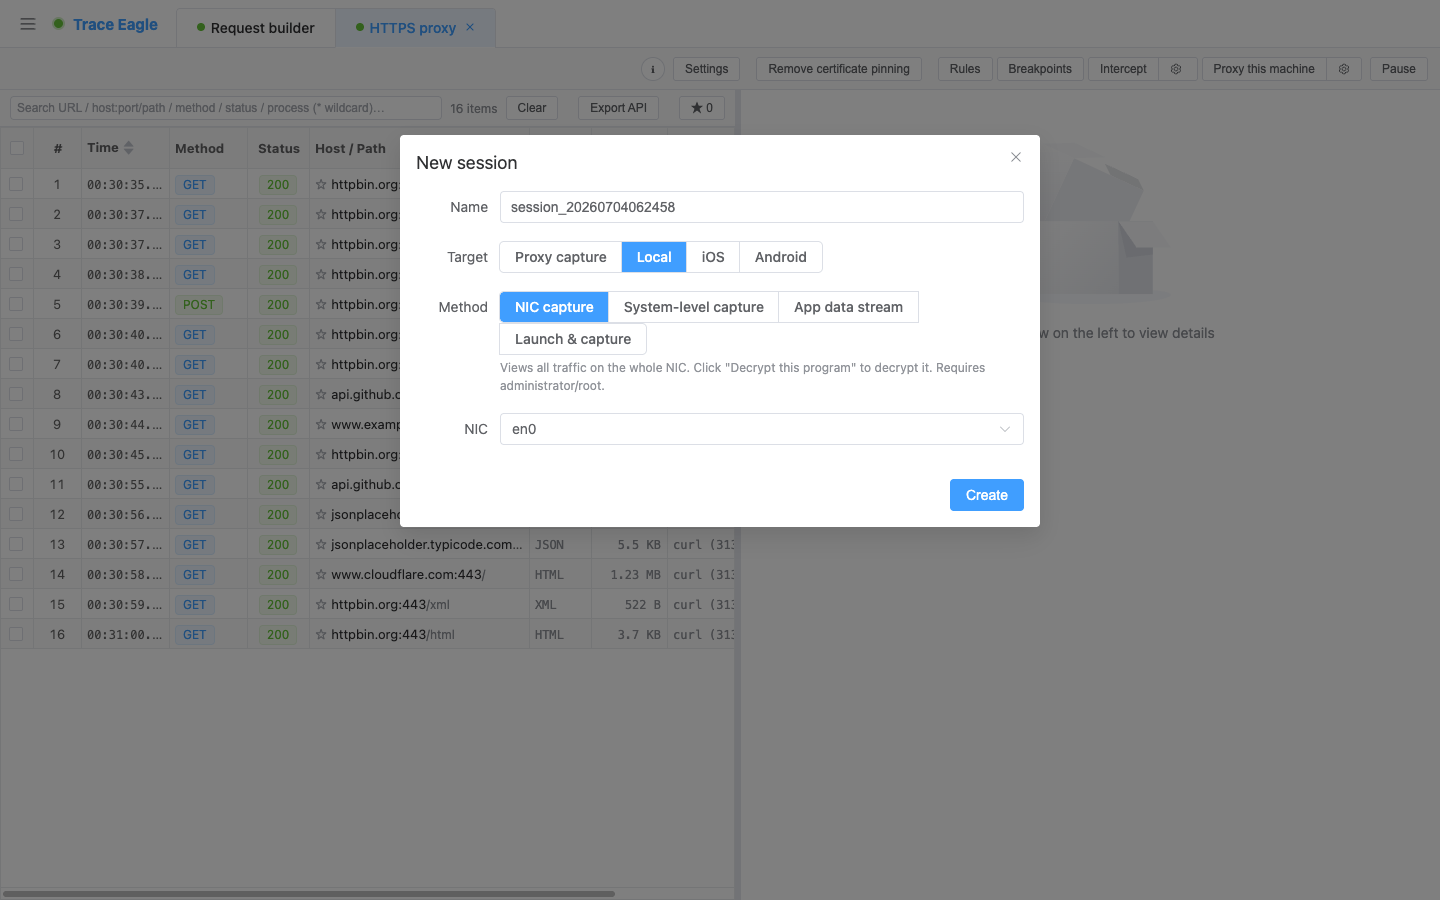
Section titled “3. How to capture”- Pick a NIC: all NICs on the machine are listed automatically, with the currently active one selected for you by default.
- Set a filter before you start, if you like: to capture only the traffic you care about, enter a capture filter. Common presets are built in (TLS / HTTP / QUIC / DNS / TCP / UDP / ICMP / ARP / SSH, and more), one click to apply.
The capture filter is set before you start and cannot be changed once capture is running; it determines “what gets captured” at the NIC layer. To narrow down within already-captured data, use the “display filter” in the packet view (see Section 6).
4. See plaintext: three steps that turn ciphertext into plaintext
Section titled “4. See plaintext: three steps that turn ciphertext into plaintext”Traffic captured off the NIC is ciphertext by default (captured as-is, with no man-in-the-middle). Seeing plaintext comes in three tiers, each backing up the last:
- Automatic decryption: common programs such as browsers and Electron apps are usually plaintext the moment they’re captured, with no extra steps.
- Manual “Decrypt this program”: for programs that can’t be decrypted automatically, click “Decrypt this program,” select it, and its encrypted traffic is decrypted. Decrypting multiple programs at once is supported.
- Two reinforcement switches:
- Restart the program: launch the target from scratch so that even its early-startup encrypted traffic is decrypted along with the rest.
- Handle child processes in one click: some programs send and receive traffic through child processes; check this box to handle the child processes too, so nothing is missed.
Common programs are plaintext the moment they’re captured, and for the rest, one manual click on “Decrypt this program” decrypts them too. Turning ciphertext into plaintext is usually a one-step affair.
5. Two views: packet by packet, and by connection
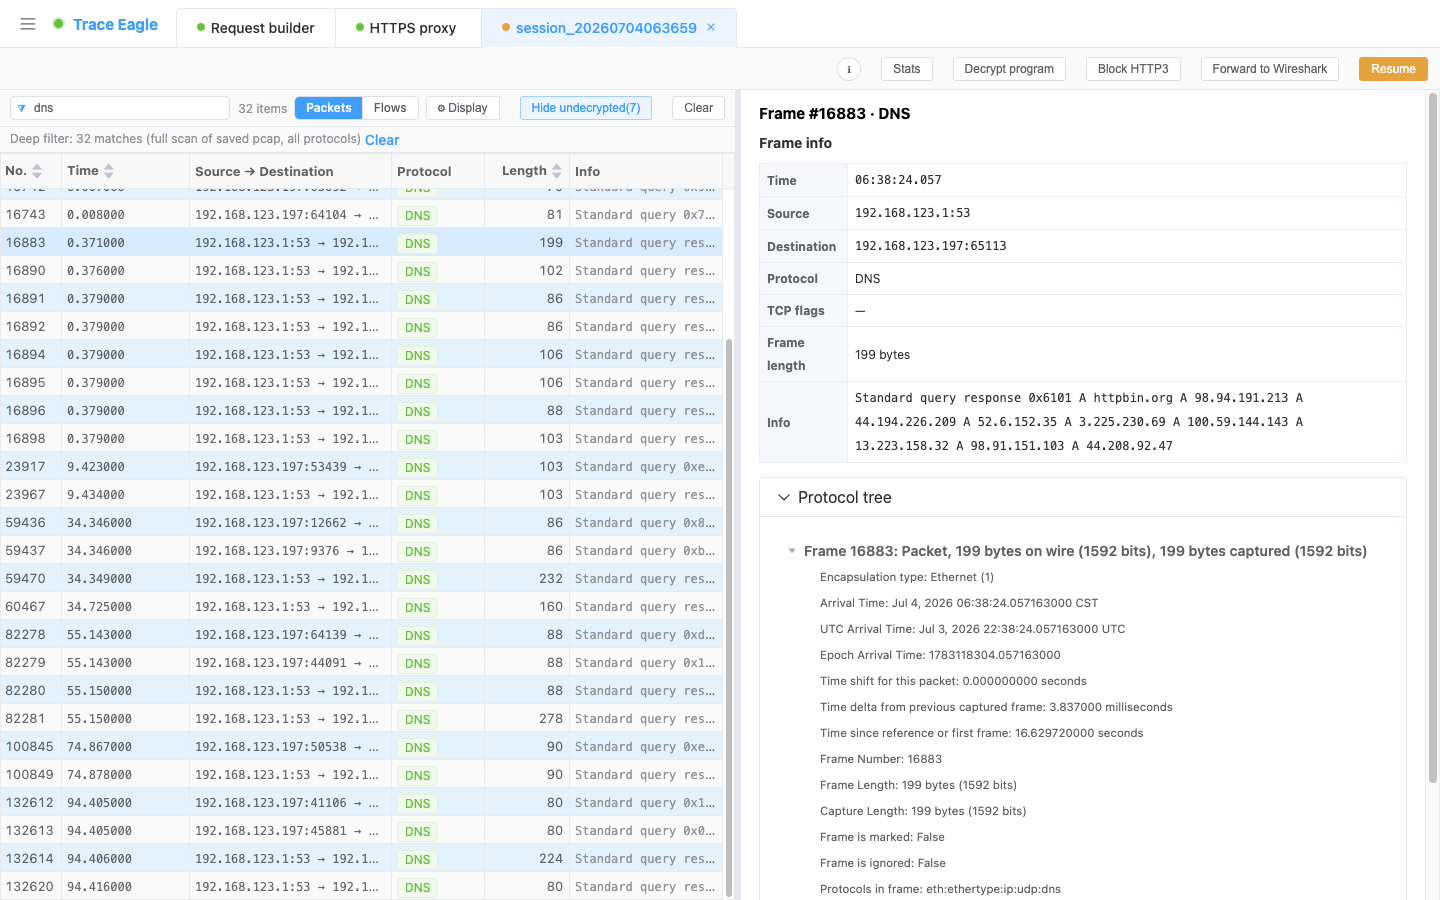
Section titled “5. Two views: packet by packet, and by connection”- Packet view: look at each packet one by one, just like a professional capture tool. Select a frame to see the frame info, the raw bytes, and the protocol tree expanded layer by layer. The search box supports Wireshark-style display filters (such as
tcp.port==443,tls.handshake), with live syntax validation as you type, so you can pinpoint anything within the full set of captured data.
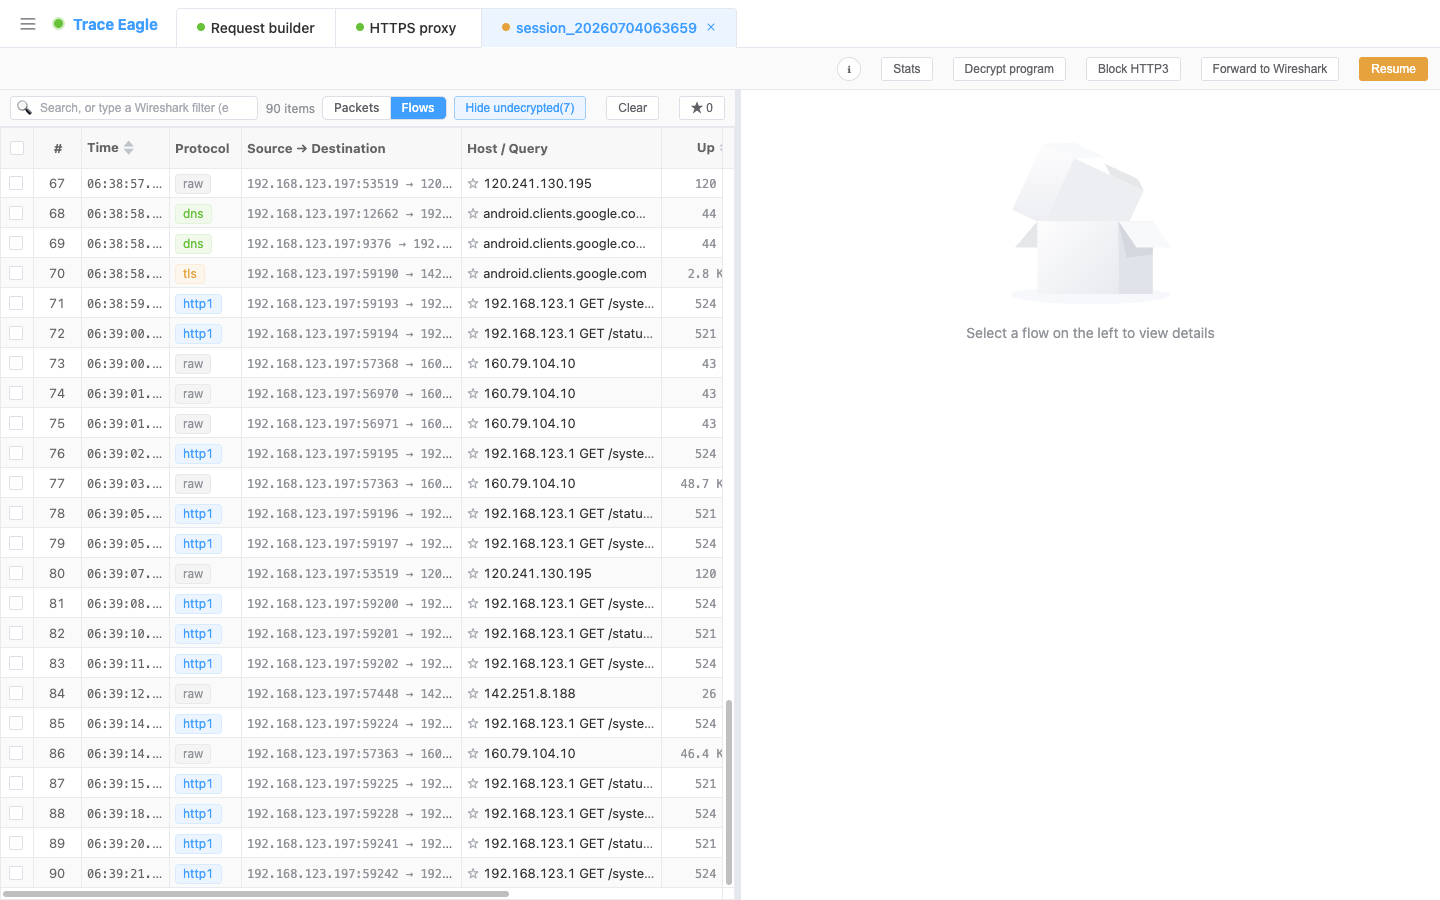
- Connection view: reassemble scattered packets into individual connections, and use “Follow Stream” to see an entire connection’s send/receive from start to finish; HTTP / DNS and others can also be viewed in a structured way.
- Right-click actions: right-click any frame to view only this connection / filter to this connection (narrow your view down to this one), mark the frame, copy the source / destination address, or for the remote IP, go straight to view host profile / ping / port scan to pick up the next step of your investigation.
- The two views cross-link (jump from a connection back to its raw packets, or from a packet follow the entire connection).
- Statistics: summaries across three tables (protocol hierarchy, conversations, endpoints), optionally over just the current filter results, to quickly see “who’s using the bandwidth, and who they’re talking to.”
- Pause anytime: pause mid-capture to look at what you’ve captured so far, get your bearings, and continue. On long sessions you don’t have to keep starting and stopping.
6. After capture: understand it, decode it
Section titled “6. After capture: understand it, decode it”The same piece of data can be viewed in multiple ways, and the engine will decode it for you automatically. This capability is common to all capture methods and applies here too:
- Multiple ways to view: structured, prettified text, hex, and auto-detect, switchable independently for each direction. See Inspect & Decode for details.
- Auto-detects many encodings: decrypted HTTP content is automatically decompressed for gzip / brotli / deflate / zstd (including multiple stacked layers), and JSON, XML, forms, protobuf / gRPC, and plist are auto-detected and prettified, with images / audio / video previewed inline. See Inspect & Decode for details.
- Custom codecs: for proprietary / in-house protocols, write a short script to teach it how to read them, splitting frames, stripping headers, and decompressing into a readable structure. See Custom Protocol Decoding for details.
7. Handling HTTP/3: capturing and decrypting QUIC traffic too
Section titled “7. Handling HTTP/3: capturing and decrypting QUIC traffic too”More and more apps are switching to HTTP/3 (QUIC), and QUIC has always been hard to capture and hard to decrypt at the NIC layer, where many tools simply stop. NIC capture works both ways: it can let the target app fall back smoothly from HTTP/3 to an ordinary connection so it becomes capturable and decryptable again (it recovers automatically when you stop the session, without affecting the app’s normal use afterward), and when the keys are available it can also decrypt QUIC / HTTP/3 directly and show plaintext.
This means that even for apps that have gone fully HTTP/3, you can still see their plaintext exchanges, instead of staring helplessly at a pile of QUIC you can’t touch.
8. Seamless handoff to Wireshark for deep analysis
Section titled “8. Seamless handoff to Wireshark for deep analysis”When you need Wireshark-level professional packet-by-packet analysis, there’s no need to keep exporting back and forth between two tools: forward this session’s traffic live into Wireshark in one click, where it opens as plaintext with no extra configuration. Decryption keys are injected incrementally, live along with the traffic, so late-arriving keys are filled in and no frames are lost.
It can even send the traffic to Wireshark on another machine, with this machine handling capture and decryption while the other focuses on analysis, a natural fit for remote collaboration and joint troubleshooting.
- Export to a file too: export a
.pcapngwith the decryption keys embedded in one click (open it in Wireshark and it’s plaintext) or a standard HAR, and hand it to a colleague to open directly with nothing else to set up.
So you get the best of both worlds: this tool’s “decryption + process attribution + one-click host profile,” plus Wireshark’s deep packet-by-packet analysis.
9. Typical use cases
Section titled “9. Typical use cases”- Viewing non-HTTP traffic: DNS, QUIC, games, IoT, all kinds of proprietary protocols. Whatever the proxy can’t catch, the NIC can.
- Understanding everything a program does on the network: which addresses it actually connects to, which protocols it uses, and whether it has any “quiet” connections.
- Not wanting to change the system proxy or install a certificate: capture directly, zero intrusion.
- Tackling proprietary protocols: after capturing the raw flow, use a custom decoder to restore it to a readable structure.
- Handing off to Wireshark for a deep dive: when you need professional packet-by-packet analysis, forward it live, where it opens as plaintext with no extra configuration.
Back to Proxy Capture · Related: Inspect & Decode · Custom Protocol Decoding · Host Details