
Session Replay and Load Testing
A captured request can be run again exactly as-is, in two modes that each do their own job: session replay reproduces a string of requests in bulk, in their original order (reproduce a flow, regression-verify, replay against a different environment); load testing applies high-frequency pressure to a single request to test whether it holds up. Both are reachable via right-click from capture records, and even private APIs that carry a signature / timestamp run just fine.
1. Three ways to “send it again”, each with its own job
Section titled “1. Three ways to “send it again”, each with its own job”Same idea of sending a captured request again, divided up by purpose:
| Capability | Role |
|---|---|
| Compose and Replay | Editing and resending a single request |
| Session replay (first half of this page) | Bulk replay of multiple requests in order, watching each one’s status and latency |
| Load testing (second half of this page) | High-frequency pressure on a single request, measuring throughput and latency percentiles |
2. Session Replay: reproduce a string of requests in bulk
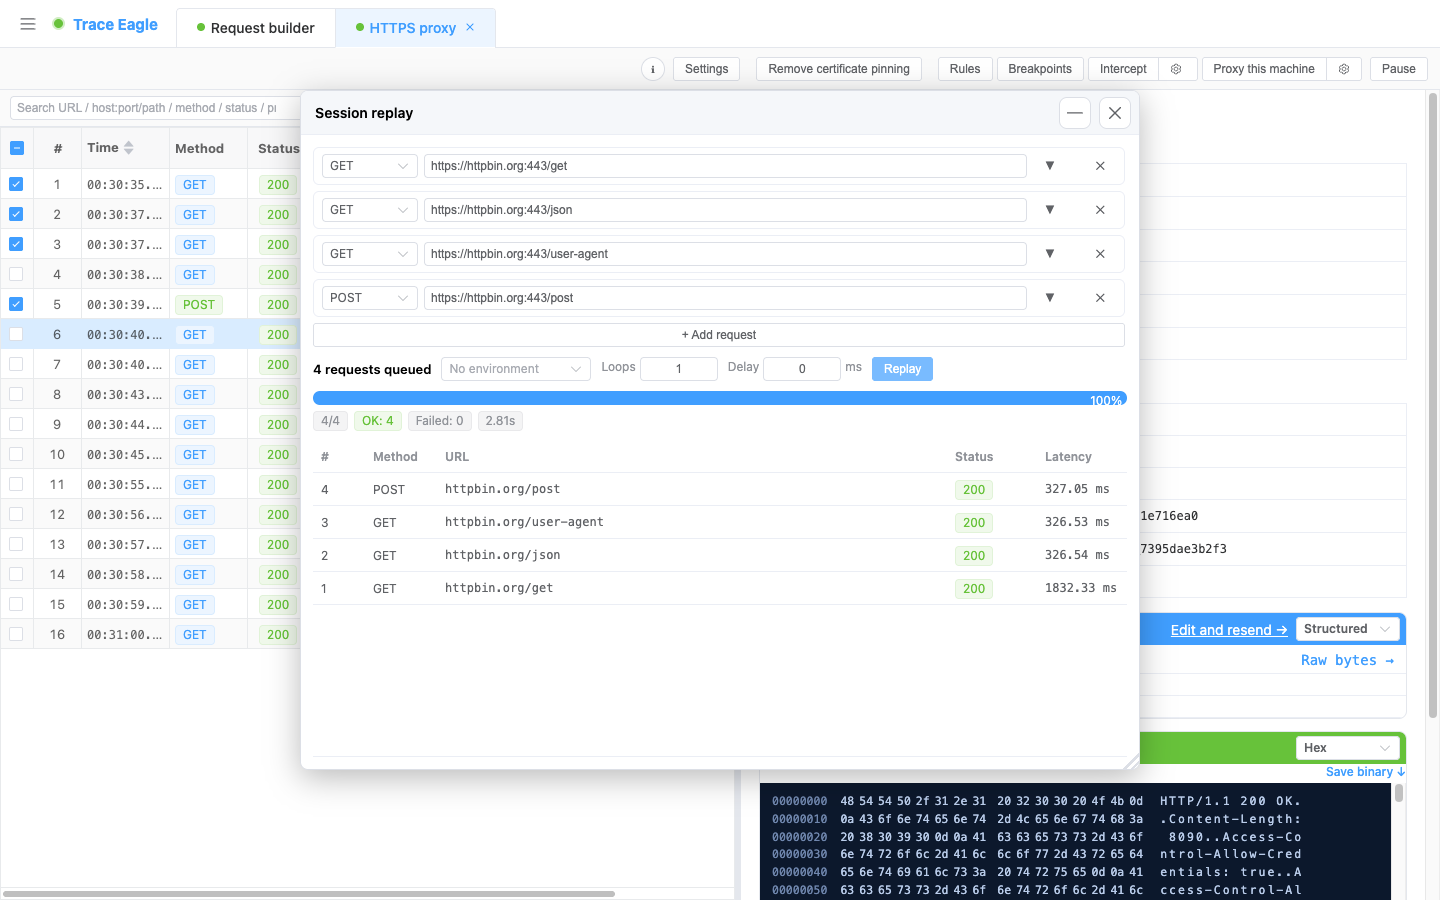
Section titled “2. Session Replay: reproduce a string of requests in bulk”Take a captured string of requests and run them again in bulk in their original order, faithfully reproducing the request sequence, with the option to loop the whole string N times.
How to get there
- Seed from a capture: right-click “Replay this request” in the capture list, or select multiple and “Replay selected requests”.
- Add manually: “+ Add request” in the panel, where each one can be edited in place, method / URL / parameters / headers / Body.
Configurable
- Loop count: run the whole sequence N times.
- Request interval: pause for a while between each one.
- Environment switch: pick an environment and replay the whole string against a different one with one click.
Results: list each request’s method, URL, status code, and latency, plus overall progress, success / failure counts, and total elapsed time.
When to use
- Reproduce a multi-step flow or a timing-dependent issue.
- Batch regression to verify a group of endpoints.
- Replay a stretch of production-captured requests as-is against a test environment.
3. Load Testing: push a single request to the limit
Section titled “3. Load Testing: push a single request to the limit”Captured an endpoint and want to know whether it holds up? Right-click “Load-test this request” on any captured request to start immediately, with throughput and latency percentiles reported in real time.
Two entry points
Section titled “Two entry points”- Load-test straight from a capture record: right-click “Load-test this request”, and the method / address / headers / body are carried over automatically and it starts immediately, with any missing protocol filled in.
- Manual configuration: open “Load test” from the toolbox and fill in the target and parameters yourself. It is a floating window, and you can run several independent load tests in several windows at once without interfering with each other.
Unlike ordinary load-test tools: here you right-click a captured request to load-test it, with no re-entering of parameters, sparing you the round trip of “capture elsewhere first, then move it into the load-test tool by hand”.
Two modes
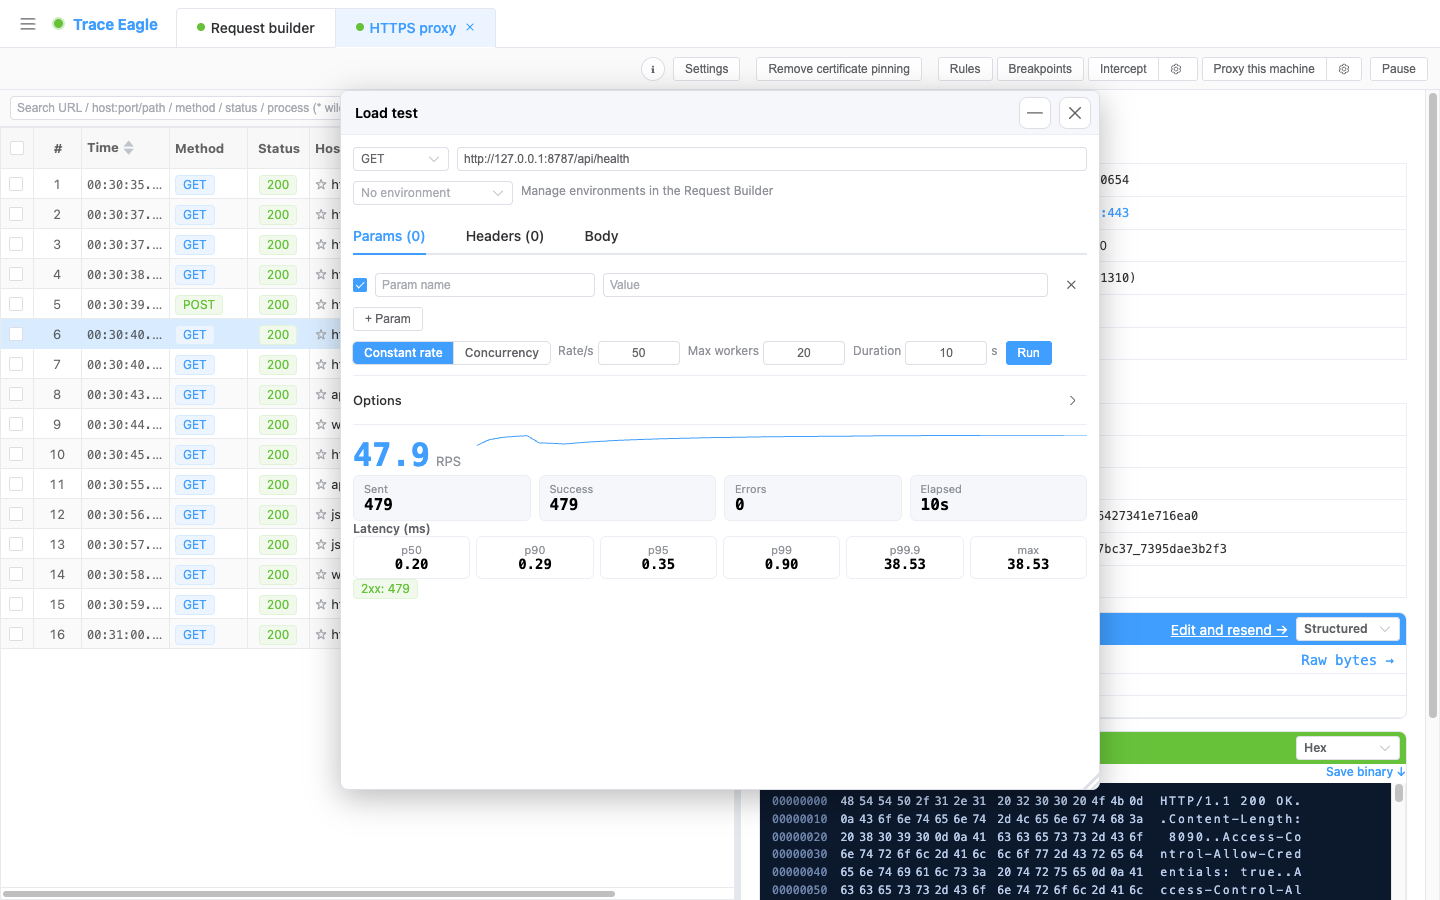
Section titled “Two modes”- Constant rate (QPS): apply pressure evenly at the configured requests per second, using a more rigorous latency measurement method, so tail latencies such as p99 stay honest under high load rather than reading artificially low, suitable for assessing “the real latency of this endpoint at X QPS”. This rigor applies mainly to this mode.
- Concurrency: fire back-to-back at a fixed concurrency to push maximum throughput, suitable for testing “the limit of what it can take”.
Configurable parameters
Section titled “Configurable parameters”- Request: method (GET / POST / PUT / PATCH / DELETE / HEAD), URL (protocol optional, https filled in automatically), Query parameter table, header table, body (JSON / form / raw).
- Pressure: rate (1–100000 req/s), concurrency / connections (1–2000), duration (1–3600 seconds, by duration rather than a fixed total count).
- Advanced: follow redirects, skip TLS verification.
- Connections: automatic connection reuse (keep-alive); automatically attempts HTTP/2 for HTTPS targets.
Real-time results
Section titled “Real-time results”- Throughput: a large live RPS number plus a live throughput line chart.
- Counts: sent / success / errors / elapsed.
- Latency percentiles (milliseconds): p50 / p90 / p95 / p99 / p99.9 / max.
- Status-code distribution: color-coded labels by 2xx / 3xx / 4xx / 5xx / error.
Stoppable at any time; closing the window automatically stops the in-flight load test.
4. Equally powerful request editing
Section titled “4. Equally powerful request editing”Whether session replay or load testing, request editing follows the same lineage as the request composer (Composer): it supports environment variables and dynamic values (UUID, timestamp, nonce, Base64, MD5 / SHA, HMAC signature, URL encoding, and more). So those private APIs that only let you through with a signature / timestamp can still be replayed in bulk and load-tested, without computing the signature by hand.
Back to Proxy Capture · Related: Compose and Replay