
Proxy Capture
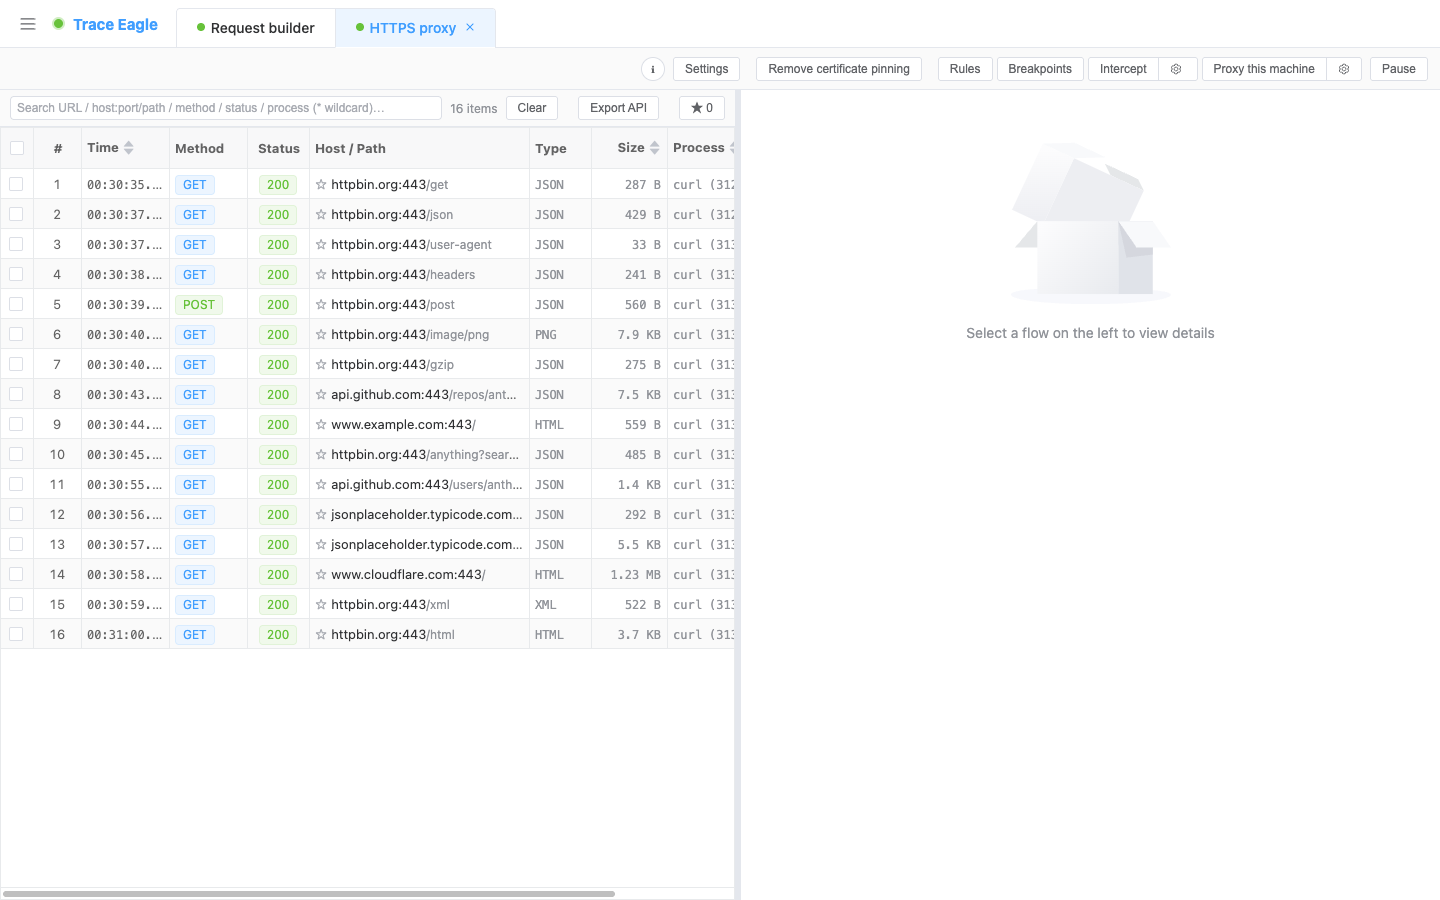
Trace Eagle’s proxy capture module brings the network requests of your computer, your phone, and other devices on your LAN into view completely, clearly, and decrypted. You don’t just look: you can edit, intercept, replay, compare, and trace them back to the source.
The fundamental difference from “yet another proxy capture tool” is this: ordinary proxy tools have only one path, “set a proxy + man-in-the-middle decryption.” The moment they meet a program that ignores the proxy, an app that uses certificate pinning, a Java / Python program, a private binary protocol, or an application sensitive to traffic characteristics, they’re basically stuck. Trace Eagle fills in these blind spots one by one: it captures even programs that ignore the proxy, decrypts even apps with certificate pinning, reconstructs even private formats, pinpoints who sent a flow even when it’s buried in system noise, and keeps traffic unchanged for applications sensitive to traffic characteristics, observing them at high fidelity without disrupting their normal operation.
1. How it differs from ordinary proxy capture tools
Section titled “1. How it differs from ordinary proxy capture tools”For the same proxy capture, the difference isn’t “can you see the request,” it’s whether you can keep working when you hit a hard case, and whether you can see deeper.
| Scenario | Ordinary proxy capture tools (Charles, Fiddler, etc.) | Trace Eagle |
|---|---|---|
| Program ignores the system proxy (many clients, background services, direct-connect traffic) | Can’t capture, misses it entirely | Transparent proxy: no app configuration needed; it still captures programs that ignore the proxy, direct-connect traffic, and traffic forwarded when the machine acts as a hotspot/gateway, and it can precisely scope by process |
| App uses certificate pinning | Errors / can’t connect / has to give up | One click to clear the target app’s certificate validation so it trusts the capture certificate and decryption continues; sites you’d rather not touch are passed through precisely |
| Java, Python, and similar programs | Even with the system certificate installed it’s useless, can’t decrypt | Full certificate coverage: these programs, which ordinary proxies can’t decrypt, decrypt here too |
| HTTP/3 (QUIC) traffic | Weak support, mostly can’t see it | Choose as needed from three tiers: downgraded capture, faithful pass-through (high fidelity), or true decryption |
| Private / binary protocols, compressed and encrypted envelopes | A pile of garbage you can’t read | Automatic decompression, automatic recognition of many formats, plus custom decoding via framing rules or JS scripts |
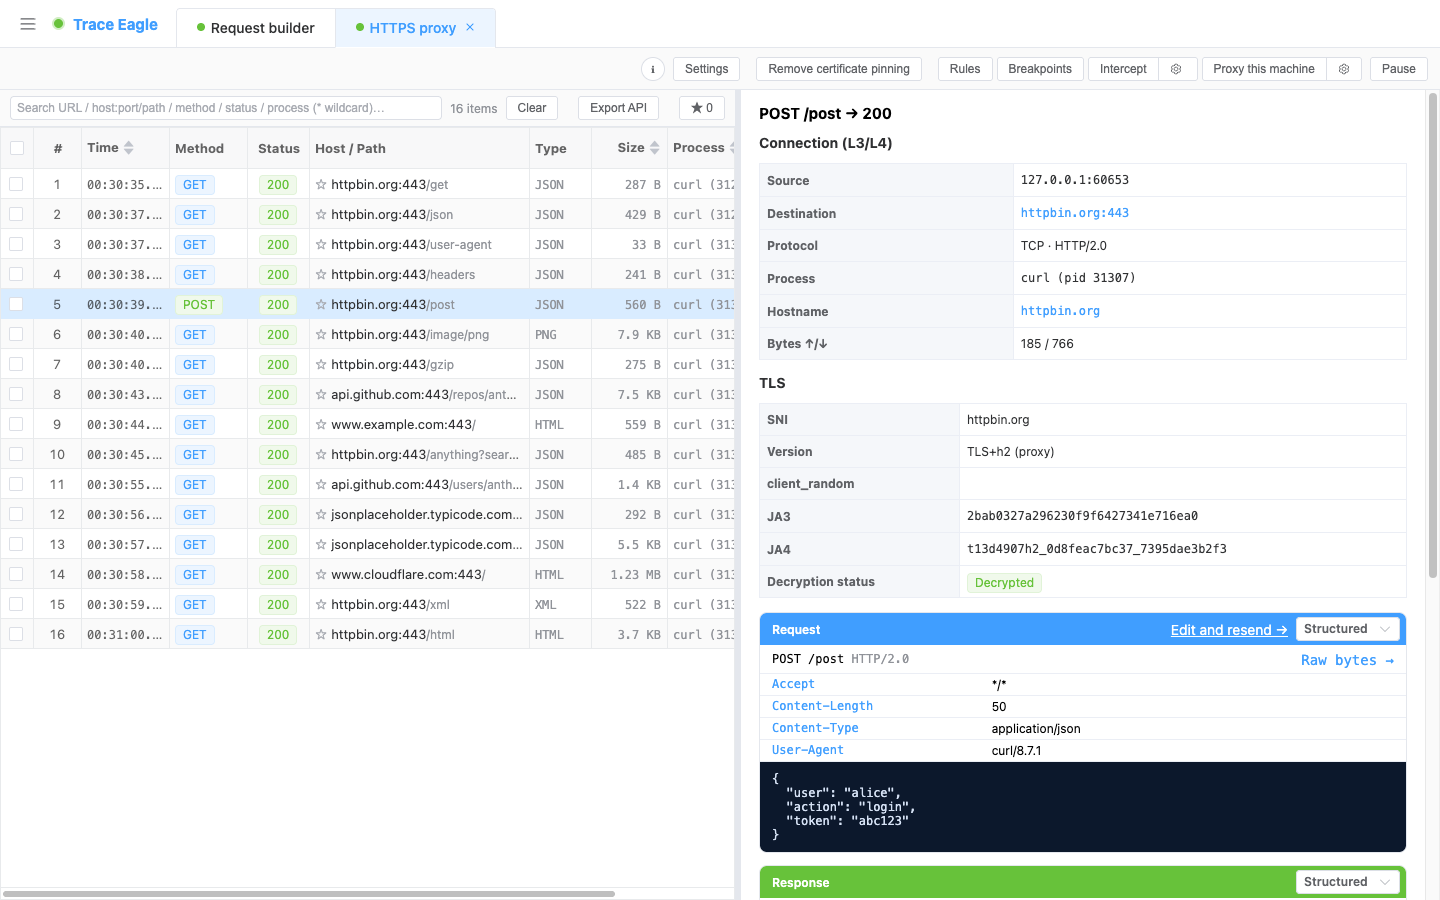
| A pile of processes mixed together, no idea which sent the traffic | Only IP / domain, you have to guess | Every flow is labeled with its source app / process; click the host to look up its full profile too |
| Want to identify who the peer is and what the client is | None | Click a host for its attribution / certificate / geo profile, and view each connection’s client fingerprint (JA3/JA4) |
| Applications sensitive to traffic characteristics | A MITM proxy changes the traffic’s characteristics, so what you observe is no longer the real traffic, and it may disrupt the target | Multiple high-fidelity modes: keep the traffic as-is without changing its characteristics, so you neither disrupt the target app nor lose sight of the real link you’re analyzing |
| Access method / parallel work | Basically only the proxy, single session | Proxy + direct NIC capture + transparent capture + mobile direct connection, multiple sessions in parallel, multiple ports without interference |
In short: ordinary tools do “proxy capture,” while Trace Eagle does “capture, decrypt, understand, and know who sent it to whom, whatever the situation.”
2. Flexible access methods (two local access modes)
Section titled “2. Flexible access methods (two local access modes)”How traffic enters the capture depends on the scenario. In the session toolbar, under “Proxy local” → gear “Access settings”, you can choose between two access modes:
- Traditional proxy (uses the system proxy, classic capture): one-click access; browsers, the command line, and most apps go through the proxy automatically. After stopping, it’s restored automatically, so normal internet access is guaranteed, and there’s a recovery fallback for abnormal exits too. Limitation: if an app doesn’t use the system proxy, it can’t be captured.
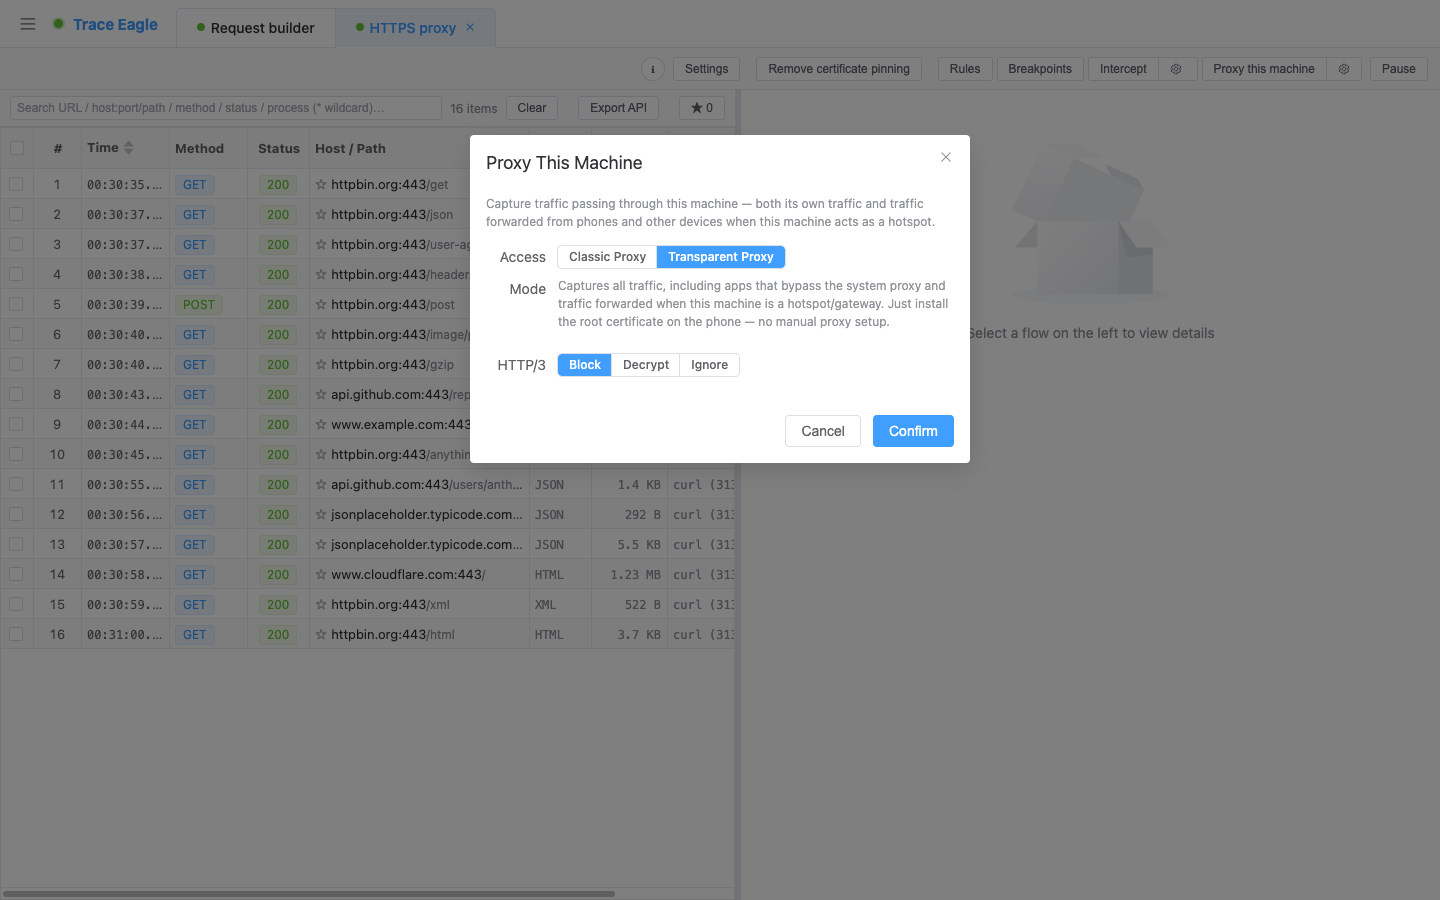
- Transparent proxy (all traffic): the blind spot of ordinary tools: no app configuration needed; all local traffic (including direct-connect traffic and traffic forwarded when the machine acts as a hotspot/gateway) can be captured; apps that don’t use the system proxy are captured all the same; you can precisely scope by app/process to capture only a few programs; on mobile, just install the root certificate, with no need to set a proxy by hand.
Capturing LAN devices: point a phone/tablet/other computer’s proxy at this machine to capture it, with a one-click certificate installation guide (iOS/macOS configuration profile, install by QR scan).
Chain an upstream proxy: the capture session itself can chain another upstream proxy on top (connecting this machine’s capture to a company proxy, jump host, or other secondary proxy); the link is transparent and doesn’t affect decryption.
3. Three tiers of HTTP/3 (QUIC) handling
Section titled “3. Three tiers of HTTP/3 (QUIC) handling”More and more apps adopt HTTP/3, and ordinary tools often break down here. In “Access settings” you can choose:
- Block (downgraded capture): try to downgrade HTTP/3 to HTTP/2 to make it capturable (a few apps don’t support this).
- Ignore (faithful pass-through): forward as-is without decrypting, high fidelity, doesn’t disrupt the program’s data requests.
- Decrypt (true H3 MITM): truly capture and decrypt, viewing plaintext just like ordinary HTTPS.
Traditional proxy supports “Block / Ignore”; “Decrypt” must be used in transparent proxy mode.
4. Decryption capability: more than “just install a certificate”
Section titled “4. Decryption capability: more than “just install a certificate””Ordinary tools’ decryption is “install one system certificate + a proxy man-in-the-middle,” which fails at the slightest defense. Trace Eagle is a combination of moves:
- One-click HTTPS decryption: a built-in certificate system; install once for continuous decryption.
- Full certificate coverage installation: one click to cover the system certificate everywhere. Java, Python, and similar programs, which ordinary proxies can’t decrypt even with the system certificate installed, decrypt here too.
- Clear certificate pinning (remove pinning): for apps that use pinning and would normally reject the connection with an error outright, one click clears their certificate validation and decryption continues.
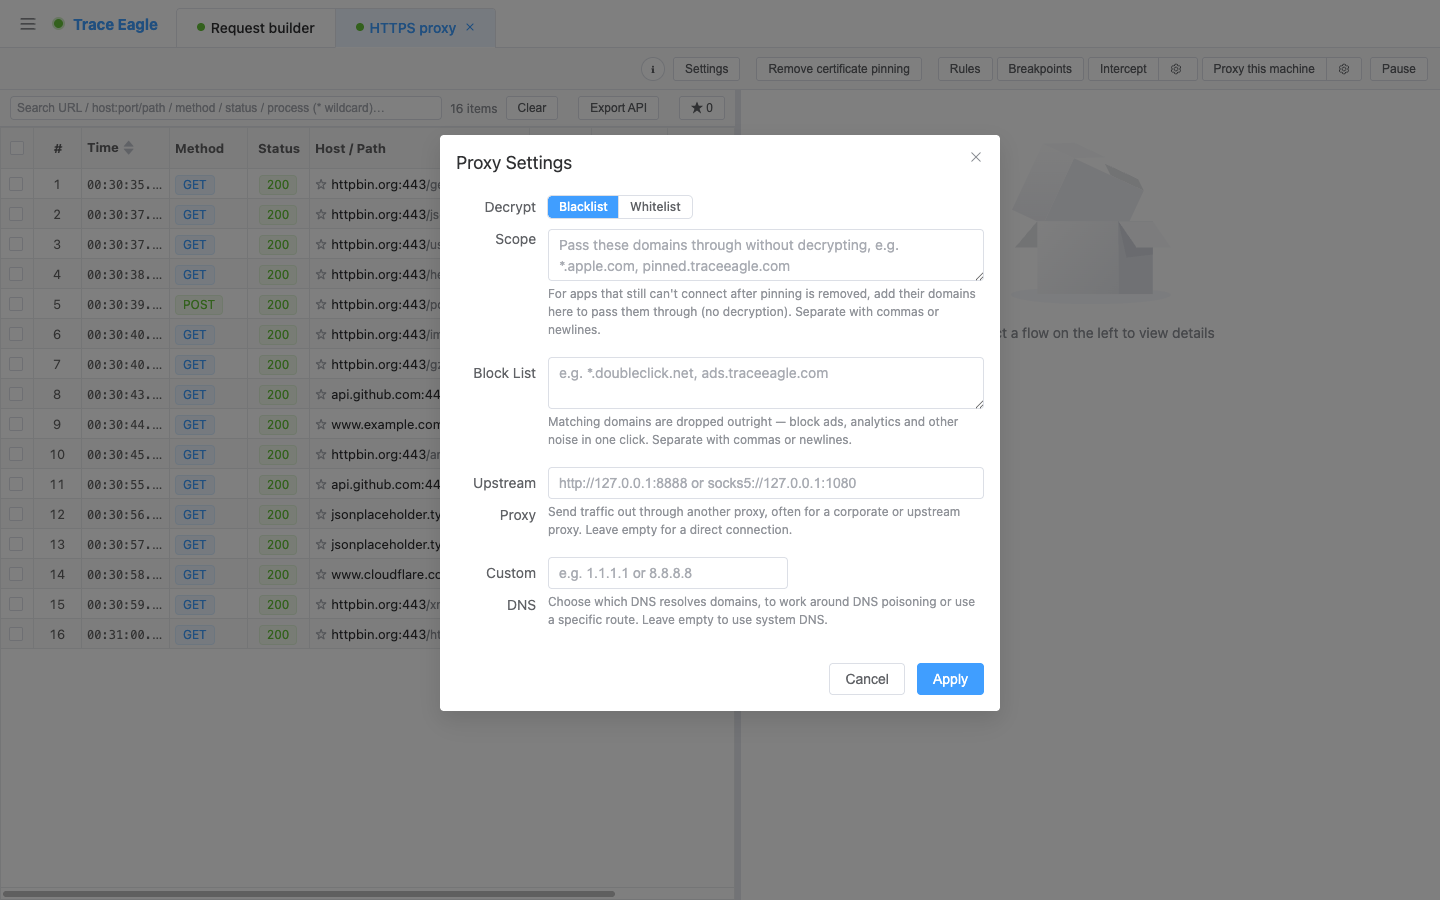
- Whitelist / allow list / block list: the whitelist decrypts only specified domains and passes the rest through directly; the allow list passes strictly-validated sites through as-is without decrypting to avoid errors; the block list drops domains you don’t want to let through outright.
5. Multiple sessions / multiple proxies in parallel
Section titled “5. Multiple sessions / multiple proxies in parallel”- Open several capture sessions at once; each is an independent tab that can be started/stopped/switched on its own.
- Sessions are completely isolated: independent flow lists, details, selection state, and configuration; multiple proxy sessions can each listen on a different port and work at the same time.
- Proxy, direct NIC capture, transparent capture, and mobile direct connection can be run at once and combined by scenario without affecting one another.
6. Full protocol support
Section titled “6. Full protocol support”| Protocol | Supported capability |
|---|---|
| HTTP / HTTPS | Complete request-response parsing, plaintext viewing |
| HTTP/2 | Native parsing, viewing experience consistent with HTTP/1.1 |
| HTTP/3 (QUIC) | Three tiers to choose from: downgraded capture / faithful pass-through / true decryption (see above) |
| WebSocket | Frame-by-frame display of sent and received messages (text/binary/ping/pong, with direction labeled) |
| Server-Sent Events (SSE) | Event streams displayed event by event |
| gRPC / protobuf | Resolve field structures without needing the .proto |
| Raw TCP / UDP | Capture raw data even for non-HTTP custom protocols |
| SOCKS5 | Shares the same port for access; both CONNECT and UDP ASSOCIATE are supported, and SOCKS traffic can be decrypted / passed through too |
7. High-fidelity observation: don’t disrupt the target, don’t change traffic characteristics
Section titled “7. High-fidelity observation: don’t disrupt the target, don’t change traffic characteristics”An ordinary man-in-the-middle proxy changes the characteristics of network requests, and the result is that what you observe is no longer the app’s real traffic, and it may affect the target app’s normal behavior. For applications sensitive to traffic characteristics (such as services that rely on network-request data fingerprints for consistency checks), this both disrupts the target and distorts the analysis.
Trace Eagle offers multiple fidelity tiers to keep the capture process as “transparent” and as close to the real link as possible: faithful observation (observe in the way closest to a real client, minimizing changes to traffic characteristics), fingerprint reconstruction (keep a consistent client fingerprint even when traffic needs to be rewritten), and fixed client profile (restore traffic characteristics to those of a standard client: desktop Chrome / Firefox / Safari, mobile Safari, or a random profile). Combined with “H3 Ignore (faithful pass-through),” even for applications sensitive to traffic characteristics you can capture and analyze faithfully while not disrupting their normal operation.
8. Process attribution and precise filtering
Section titled “8. Process attribution and precise filtering”- See at a glance who sent it: every flow is labeled with its source app/process, so you quickly pinpoint the target in a crowded environment, something ordinary tools that only show IP/domain can’t give you.
- Capture only what you care about: combine with the transparent proxy to precisely scope the capture by app/process and shut out the noise.
9. More powerful companion capabilities (each its own article)
Section titled “9. More powerful companion capabilities (each its own article)”Once captured, “understand, trace, rewrite, replay, load-test” each go deep, so they’re detailed in separate articles:
| Capability | In one sentence | Details |
|---|---|---|
| Inspect and decode | 5 viewing modes + automatic decompression/recognition/prettifying + inline media preview + private-protocol framing/script decoding | Inspect and decode |
| Host details | Click any host for attribution (ASN/organization/registration) + geo map + DNS + TLS certificate check + web tech stack | Host details |
| Rewrite rules and breakpoint interception | Simple rules edit requests by point-and-click, no scripting needed + breakpoints edit each one by hand + scripts/plugins as a fallback for complex scenarios | Rewrite rules and breakpoint interception |
| Request composing and replay | One-click resend/edit-and-replay + request composer + dynamic-value signing + collections/environments + code generation | Request composing and replay |
| Request comparison (Diff) | Compare two requests/responses side by side line by line, across sessions and sources, to see at a glance where they differ | Request comparison |
| Session replay and load testing | Replay a string of requests in order in batches; right-click a single one for “load-test this request,” with real-time throughput and latency percentiles | Session replay and load testing |
There’s also one lightweight but handy capability:
- Connection fingerprint (JA3 / JA4): for any HTTPS connection, view its client TLS fingerprint (JA3 with raw string, JA4, one-click copy). It doesn’t change with IP/UA and is used to identify the client type and aid traffic tracing and security analysis.
10. Typical use cases
Section titled “10. Typical use cases”- API integration debugging: mock to produce data; forward a production endpoint to a local/test environment.
- Mobile capture: capture a phone app’s HTTPS requests to analyze endpoints and troubleshoot.
- Tackling the hard cases: programs that ignore the proxy, use certificate pinning, or are written in Java / Python; handle them with the transparent proxy + remove pinning + full certificate coverage.
- Private-protocol analysis: resolve the structure of binary/custom protocols with framing rules or scripts.
- Fault troubleshooting: see clearly what the request sent and what the server returned, to pinpoint parameter/return/cross-origin issues.
- Weak-network testing / load testing: use rules to simulate a poor network; use load testing to assess an endpoint’s capacity.
- Security auditing / asset inventory: review outbound communications, check for sensitive-information leaks, verify certificates, and use host profiles to figure out the peer’s attribution.
- High-fidelity analysis: for applications sensitive to traffic characteristics, capture and analyze faithfully while keeping the traffic as-is and not disrupting its behavior.
Proxy capture is part of Trace Eagle’s data collection capabilities. Besides the proxy method, the product also supports direct NIC capture, mobile device direct connection, and other capture methods, which can be flexibly combined by scenario.