
Web Inspector
A layout that only breaks on the phone, a button that does nothing, an H5 page that renders blank — on the desktop you press F12 and see why. On a phone you add
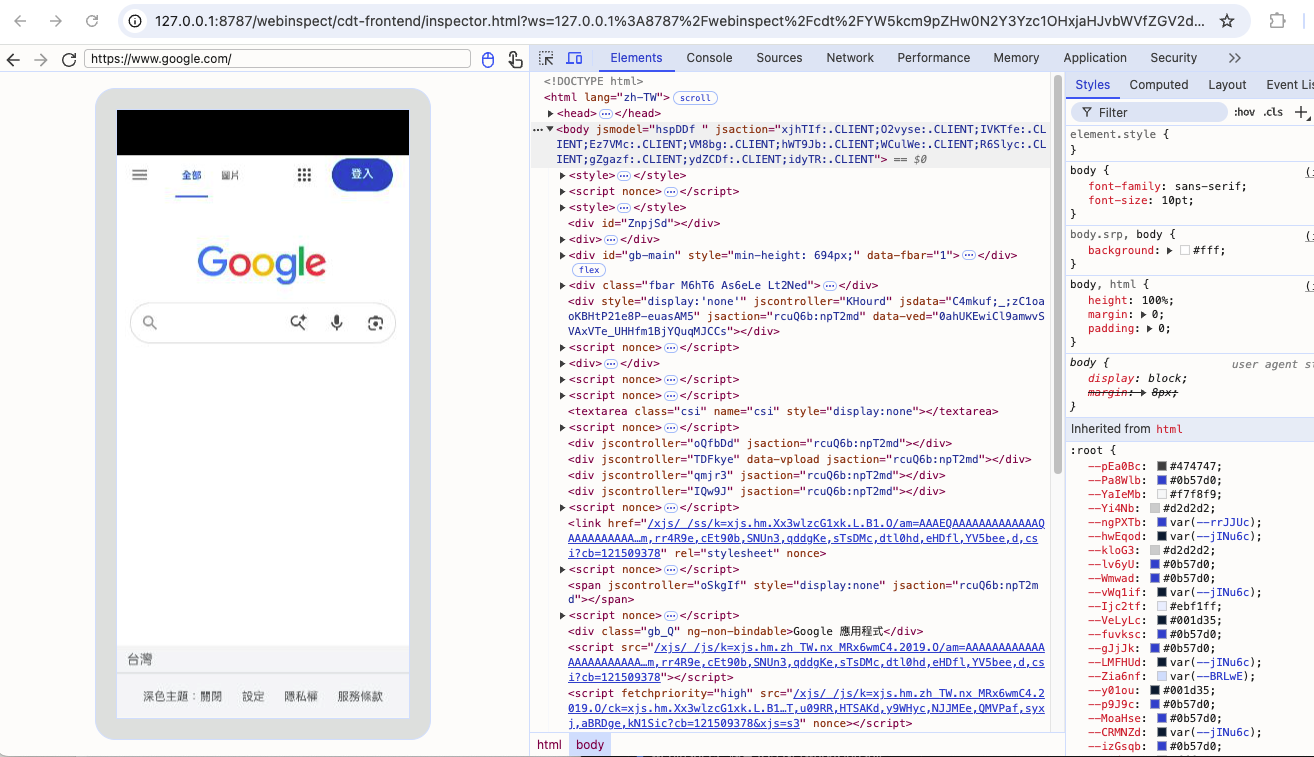
alertcalls, rebuild, and look again. The Web Inspector attaches those same developer tools to the real page on the device: plug in the cable and Elements, Console, Sources, Network and Storage are on your computer, with the phone re-rendering the moment you change a value.
1. How it divides work with packet capture
Section titled “1. How it divides work with packet capture”You want both, but they answer different questions:
| Packet capture | Web Inspector | |
|---|---|---|
| Answers | What went over the network | What the page did |
| Shows | Requests / responses, headers, bodies (decrypted) | DOM tree, computed styles, console errors, call stacks, cookies and storage |
| Typical question | What did this endpoint return, are the parameters right | Which line of JavaScript sent this request, why didn’t that style apply |
Capture shows you the request but never the caller; the inspector lets you set a breakpoint in Sources and step back to the line that sent it. Both live in the same tool, so moving between them costs nothing.
2. One-time setup
Section titled “2. One-time setup”The three blocks below are alternatives — do the one that matches your target, and only once.
iOS device
Section titled “iOS device”Plug in the cable, keep the device unlocked, and turn on the Web Inspector switch:
- Safari: Settings → Safari → Advanced → Web Inspector
- Chrome: Chrome Settings → Content Settings → Web Inspector
This switch is the step people miss most often on iOS. Without it the device is detected, but the page list comes back empty.
Android device
Section titled “Android device”Plug in the cable and enable USB debugging in Developer options. Android emulators are usually picked up without a cable.
Browser on this computer
Section titled “Browser on this computer”Start Chrome or Edge with --remote-debugging-port=9222, then hit Refresh in the page list:
# macOS"/Applications/Google Chrome.app/Contents/MacOS/Google Chrome" --remote-debugging-port=9222
# Windows"C:\Program Files\Google\Chrome\Application\chrome.exe" --remote-debugging-port=9222
3. Debugging pages inside an app
Section titled “3. Debugging pages inside an app”Skip this section if browser tabs are all you need.
For your own app, switch it on once in code:
// Android: call once when the Application or Activity startsWebView.setWebContentsDebuggingEnabled(true);// iOS 16.4 and later: make the WKWebView inspectablewebView.isInspectable = trueFor someone else’s app, or when changing code isn’t an option: tick “Also include pages inside apps” in the dialog and the pages running inside currently-open apps join the list. Untick it and you’re back to browser tabs only.
| Requirement | Notes | |
|---|---|---|
| Android | A rooted device | Enables WebView debugging on running apps, with no repackaging |
| iOS | Dev-signed apps only | A system limit — apps installed from the App Store can’t be included |
Either way, you never rebuild the app, sign anything, or install a helper on the device. When the session ends, the device is back to how it was.
4. Start debugging
Section titled “4. Start debugging”With setup done, every session is just this:
New capture → target (This computer / iOS / Android) → method “Web inspector” → Refresh → pick the page → Inspect
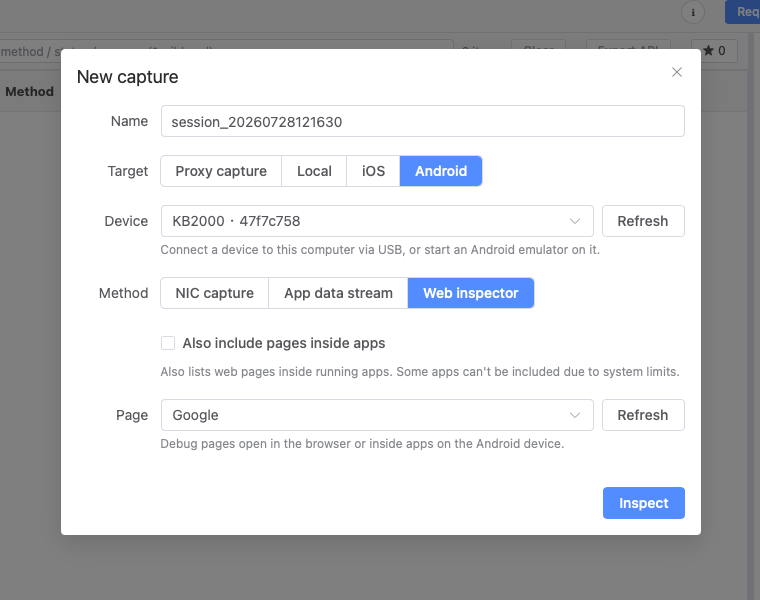
- Pages are listed grouped by the app that owns them, so an in-app page is easy to tell from a browser tab.
- Click Inspect and full developer tools open in your desktop browser, attached to that page on that device.
- Open as many as you like — one window per page, all live at once.
5. What you get
Section titled “5. What you get”The same panels you use on the desktop every day, pointed at the page on the phone.
| Panel | What it does |
|---|---|
| Elements | The page’s live DOM tree with computed styles, inheritance and the box model. Change a value and the device re-renders on the spot — the fastest way to pin down a mobile layout bug |
| Console | Every error and log the page produced, plus a prompt that runs your JavaScript inside that page on that device |
| Sources | Browse the scripts and stylesheets the page loaded, set breakpoints, walk the call stack and inspect variables at the moment things go wrong |
| Network | Every request the page made, in a waterfall: status, type, initiator, size, timing and cache state, with totals for requests, bytes, DOMContentLoaded and full load time |
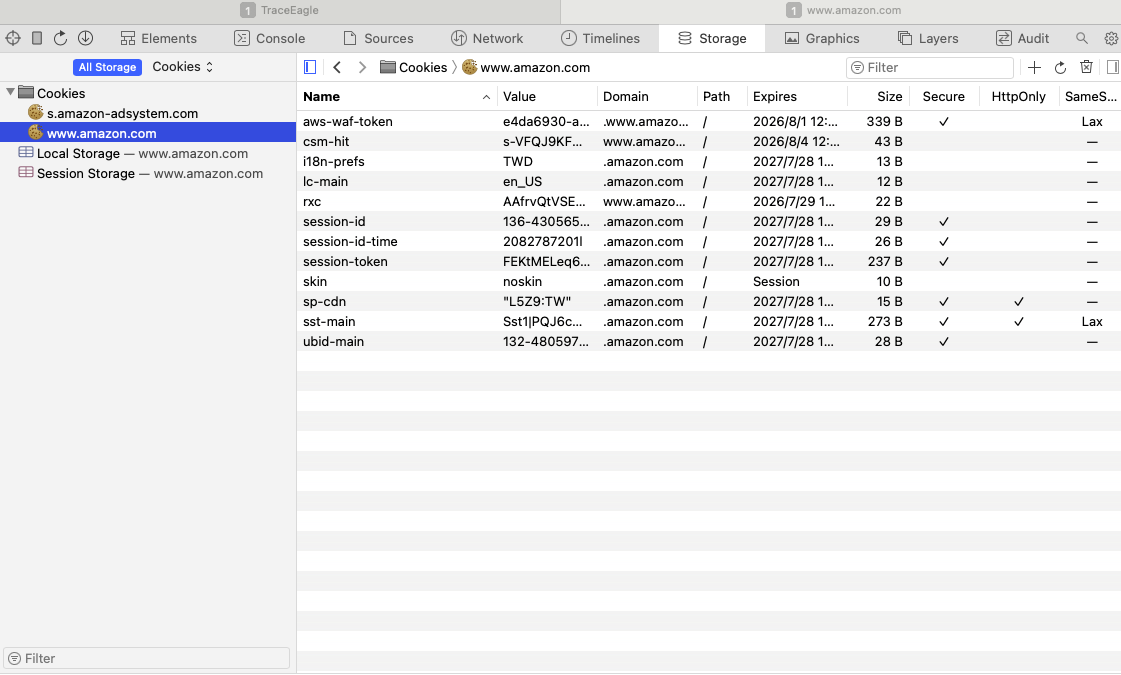
| Storage | Cookies grouped by domain with expiry, Secure, HttpOnly and SameSite, next to localStorage and sessionStorage — the fastest way to unpick a login-state bug |
On Android, the live device screen is mirrored beside the panels and you can click and scroll it with the mouse — inspect and operate on one screen instead of juggling phone and keyboard.
6. What’s supported
Section titled “6. What’s supported”| This computer | iOS | Android | |
|---|---|---|---|
| Browser tabs | ✓ | ✓ | ✓ |
| Pages inside apps (WebView / WKWebView / H5) | ✓ | ✓ | ✓ |
| Emulator / simulator | — | ✓ | ✓ |
| Inspect and edit elements & styles live | ✓ | ✓ | ✓ |
| Console, breakpoints and step-through | ✓ | ✓ | ✓ |
| Network waterfall for the page | ✓ | ✓ | ✓ |
| Cookies / localStorage / sessionStorage | ✓ | ✓ | ✓ |
| Live device screen beside the panels | — | — | ✓ |
| No certificate and no proxy to set up | ✓ | ✓ | ✓ |
7. Nothing shows up? Check these first
Section titled “7. Nothing shows up? Check these first”| Symptom | Usually | What to do |
|---|---|---|
| Device detected, page list empty | The iOS Web Inspector switch is off, or the screen locked | See section 2; turn it on, keep the device unlocked, then Refresh |
| Android shows no in-app pages | That WebView never had debugging enabled | Your own app: add setWebContentsDebuggingEnabled(true). Someone else’s: tick “Also include pages inside apps” (rooted device) |
| One iOS app never appears | A system limit | App Store builds can’t be included — only dev-signed apps can |
| The local browser lists no pages | It was started without the debugging port | Restart Chrome / Edge with --remote-debugging-port=9222 and Refresh |
| Inspect does nothing | An unsupported browser | Android and local sessions need Chrome, Edge or Brave |
8. When to reach for it
Section titled “8. When to reach for it”- The page breaks only on the phone: layout, hit areas, font rendering.
- An H5 page is blank or broken and you need console errors and a call stack.
- You want to know which script sent a request — capture alone won’t tell you.
- You’re chasing a login or cache problem and need to see what’s really in cookies and storage.
- You’re debugging H5 embedded in an app, where ordinary tooling gives you nothing.
Back to Getting started · Related: Inspect & decode · iOS capture · Android capture